
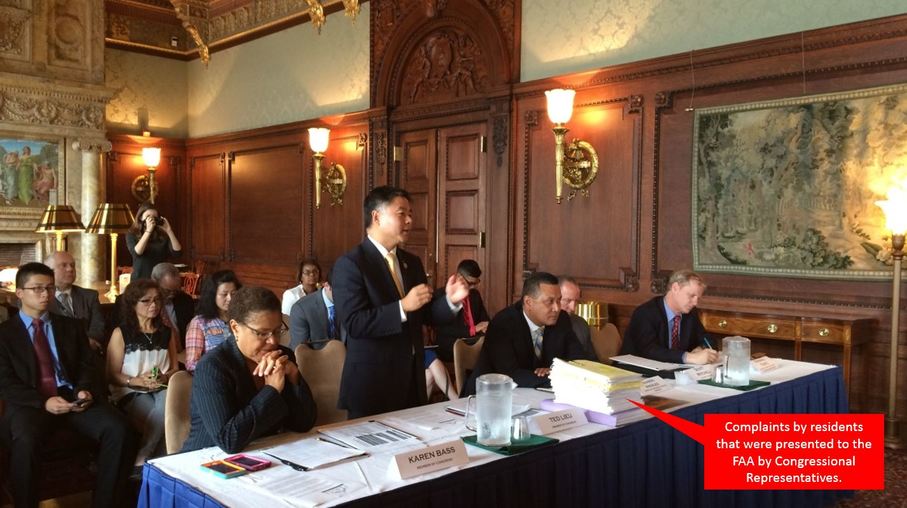
COngressional Meeting with FAA
Geospatial Distribution of SMO's Negative Impacts
Partial Sample (2015)
A Geospatial Analysis of the Distribution of Westside Residents
Negatively Impacted by the Santa Monica Airport
A Geospatial Analysis of the Distribution of Westside Residents
Negatively Impacted by the Santa Monica Airport
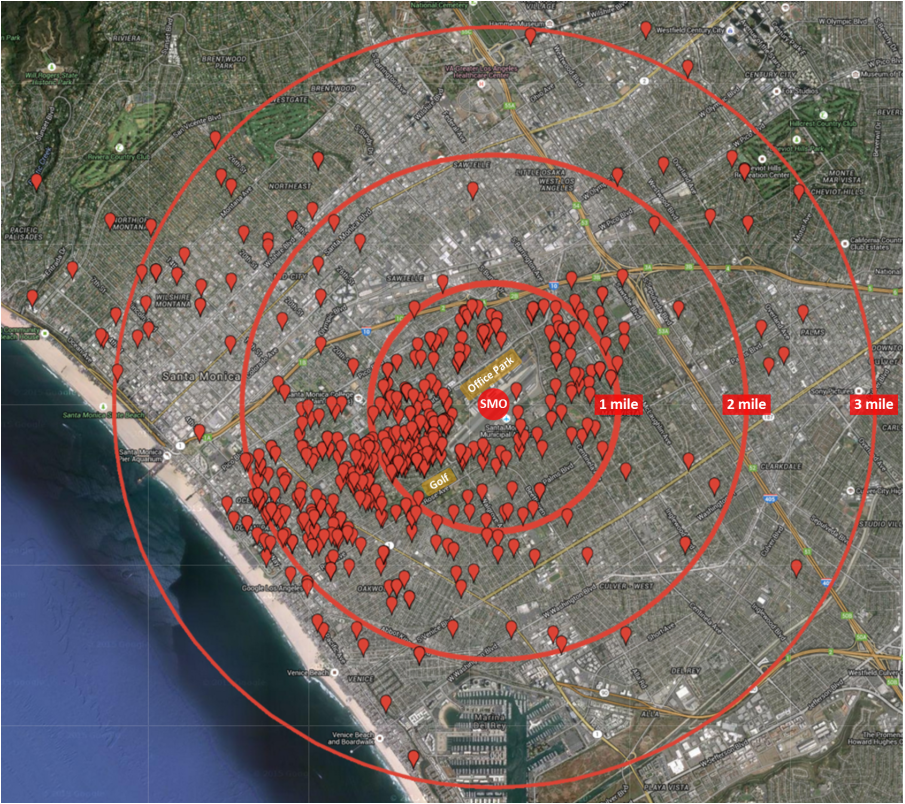
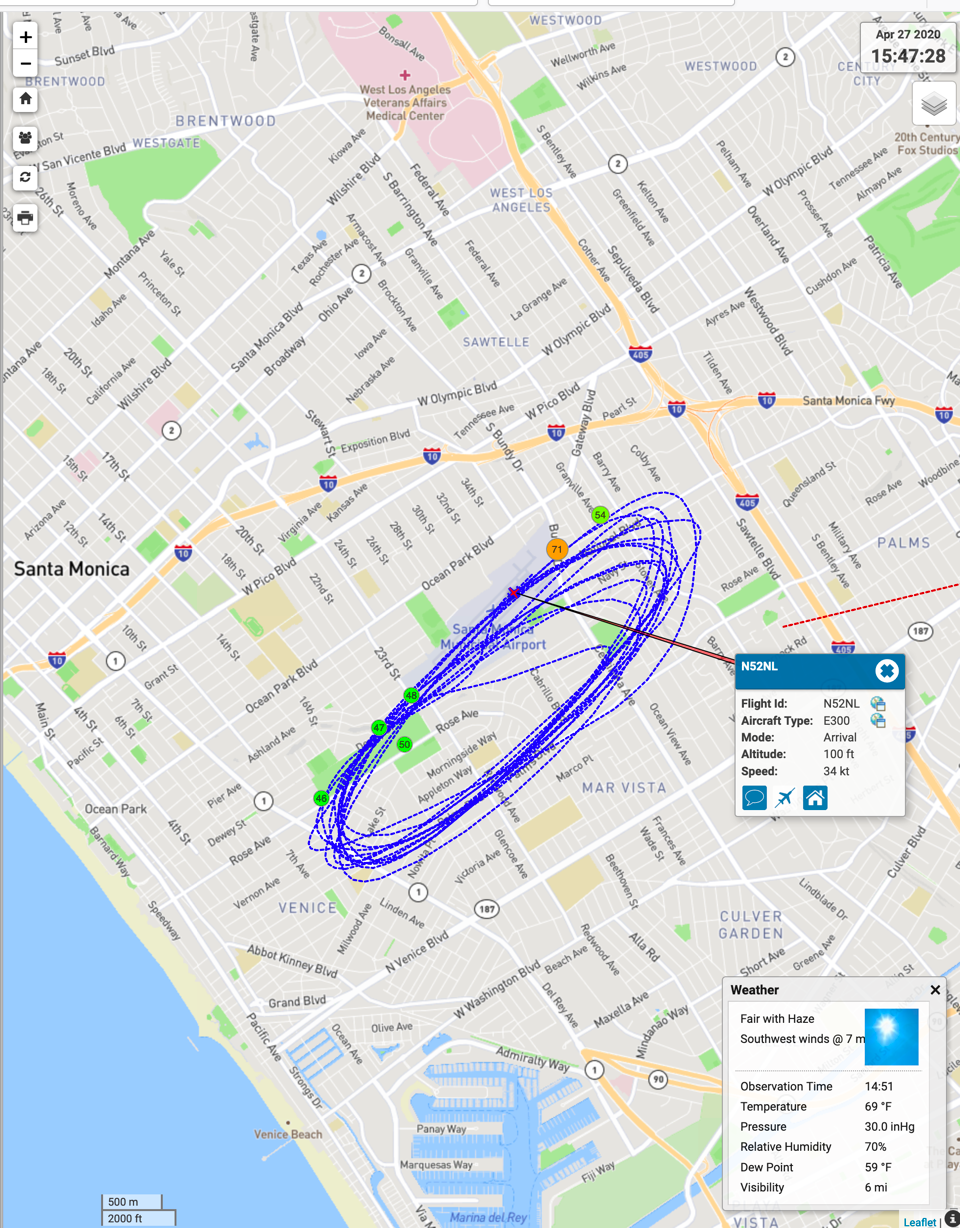
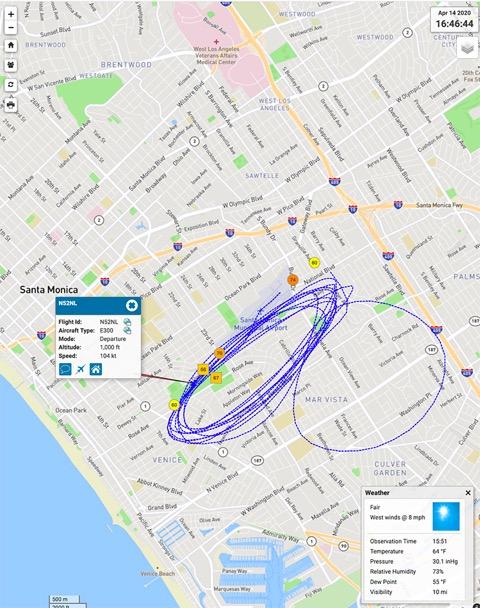
There are over 130,000 residents within 2-3 miles radius of the Santa Monica Airport.
Red markers indicate a partial sample of documented complaints by residents that were presented to the FAA by Congressional Representatives.
Red markers indicate a partial sample of documented complaints by residents that were presented to the FAA by Congressional Representatives.
U.S. Department of Transportation Noise Map
Click on map below to explore the map.
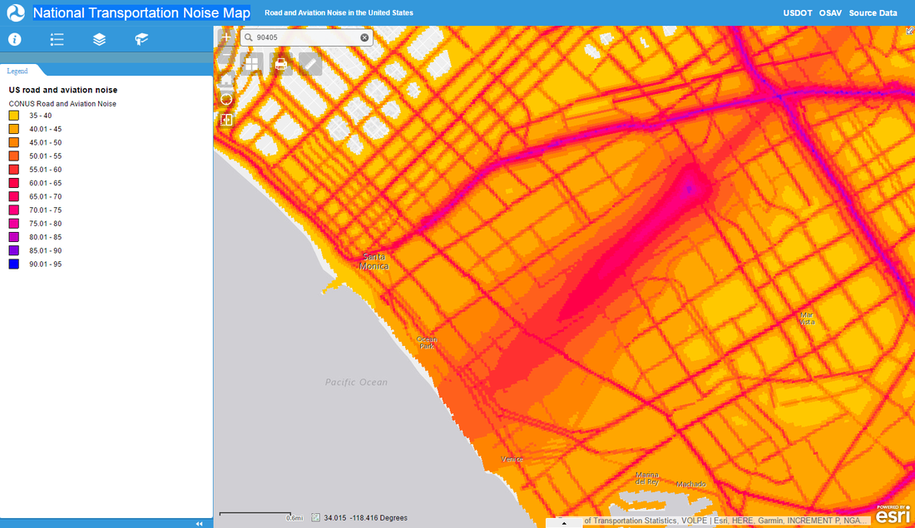
U.S. Department of Transportation Noise Map Link:
https://maps.dot.gov/BTS/NationalTransportationNoiseMap/
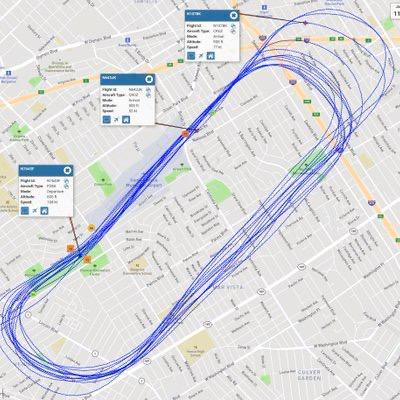
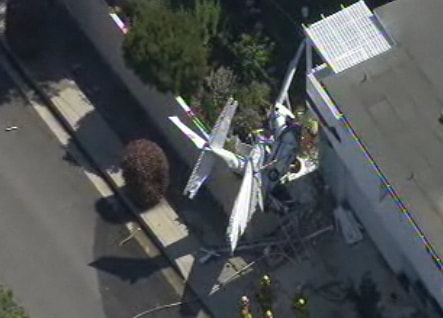
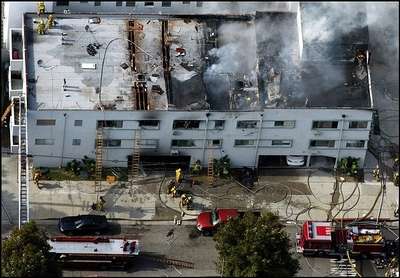
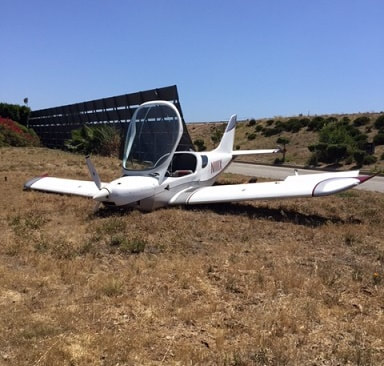
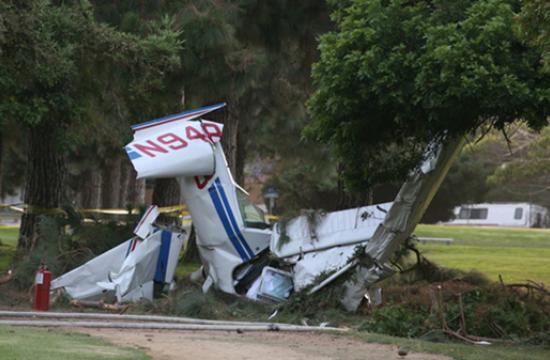
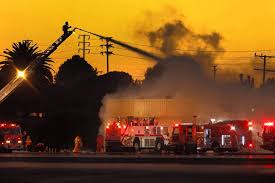
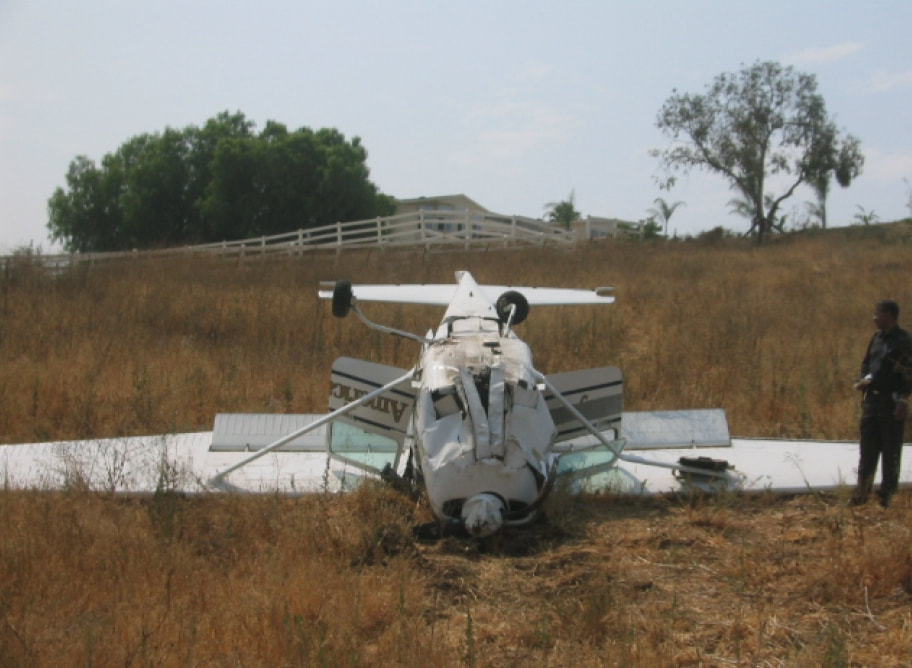
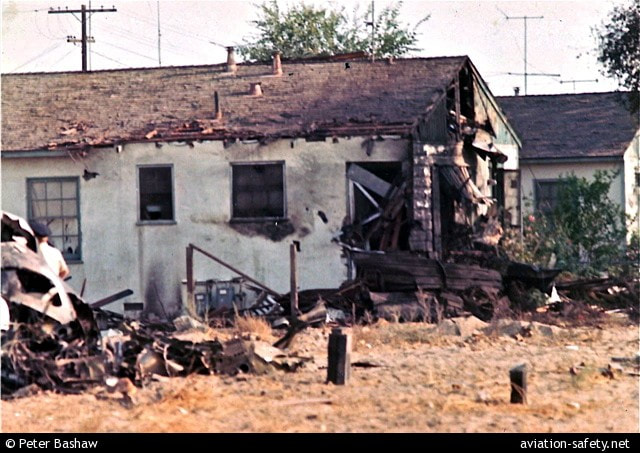
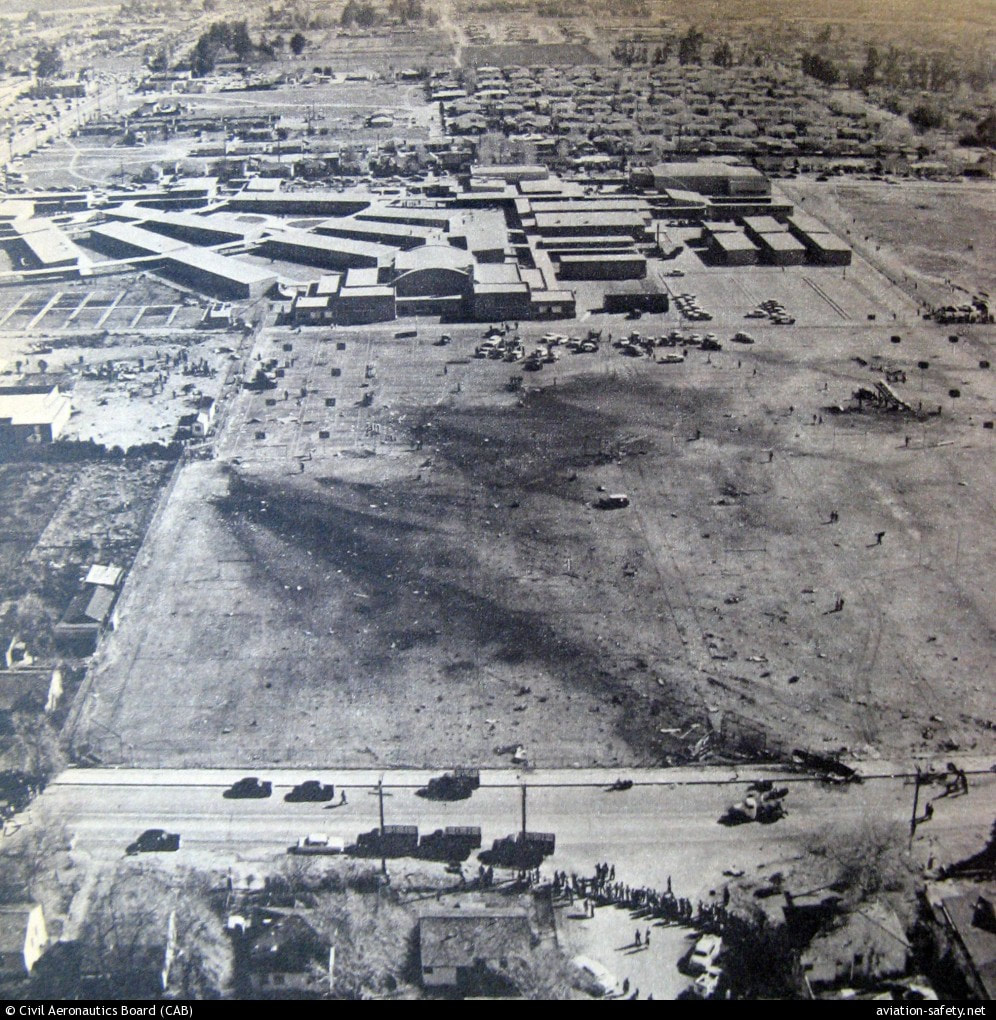
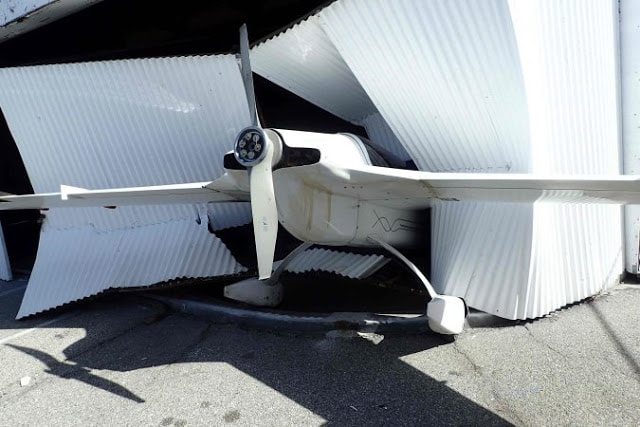
Photos, Images, and VideoS on Negative Impacts
Sources:


|
|
|
|
